An Alerting strategy for the cloud
There arent much articles out there on alerting strategies. I found that out when I was developing one myself to implement a robust alerting system. Its been a couple of years since then and not much has changed. Some gems of knowledge on alerting remain in books but not widely published on the internet. This article is an attempt to address that gap.
- Need for Alerting
- Need for an Alerting strategy
- Industry frameworks
- Cloud alert types
- Prioritisation
- Channels
- Recipients
- Use case
- Best practices
- References
Need for Alerting
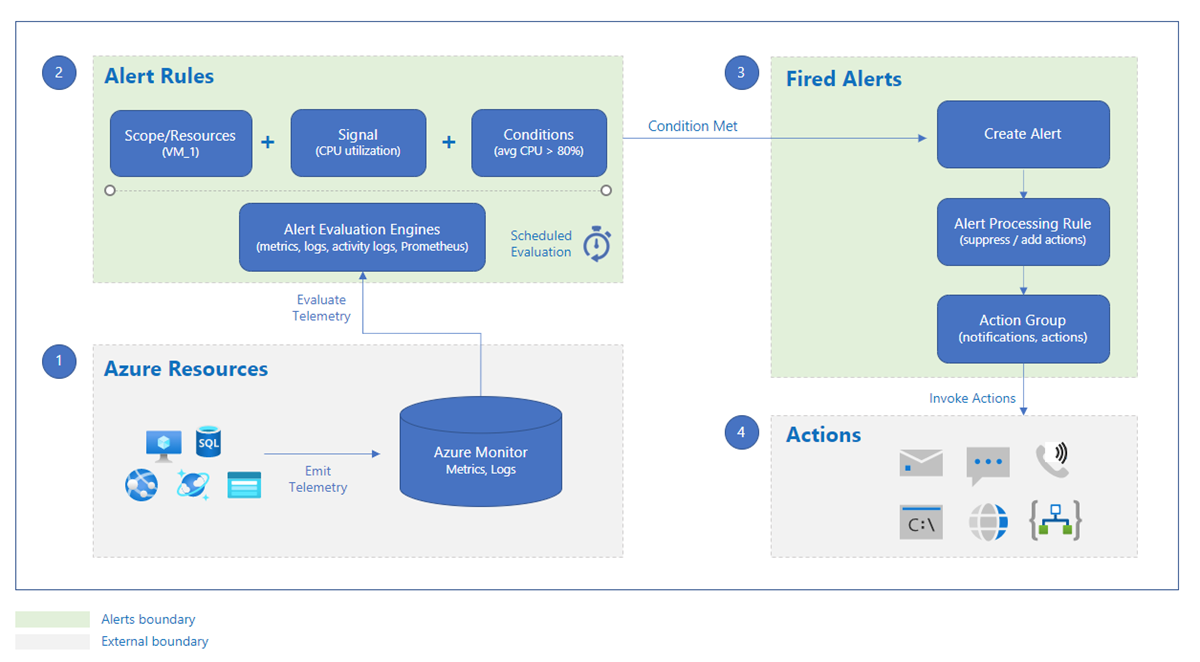
Alerting is an essential step of monitoring. Monitoring provides you visibility into the health of your systems. The benefits of alerting are :
- An alert can contain enough contextual information to help us quickly get started on diagnostic activities.
- Alerting can be used to invoke remediation functions such as autoscaling.
- Alerts can also enable cost-awareness by watching budgets and limits.
 ref: https://learn.microsoft.com/en-us/azure/azure-monitor/alerts/alerts-overview
Need for an Alerting strategy
A robust alerting strategy provides you a plan to structure your alerts and rules to manage various anomalies in the system. An alerting strategy defines the organization’s standards for:
- The types of alert rules that you’ll create for different scenarios.
- How you’ll categorize and manage alerts after they’re created.
- Automated actions and notifications that you’ll take in response to alerts.
Industry frameworks
Reviewing the popular methodologies of USE, RED, and the Four golden signals, you’ll find that they have requests, latency, and errors in common. Security and cost can be additions to this if they are measurable.
The Four Golden Signals
Rob Ewaschuk described the “four golden signals” as the most important metrics to focus on at a high level. It was developed by Google’s SRE teams.
- Latency
- The time it takes to service a request.
- Errors
- The rate of requests that are not successful.
- Traffic
- A measure of how much demand is placed on your system.
- Saturation
- How full your service is.
- A measure of your system fraction, emphasizing the resources that are most constrained (Eg: In a memory-constrained system, show memory; in an I/O-constrained system, show I/O).
The RED method
For request-driven applications (like microservices), Tom Wilkie defined the RED Method:
- Rate
- The number of requests per second a service is processing.
- Errors
- The number of failed requests per second.
- Duration
- Distributions of the amount of time each request takes.
The USE method
Brendan Gregg proposed the USE Method for characterizing the performance of system resources:
- Utilization
- The average time that the resource was busy servicing work.
- Saturation
- The degree to which the resource has extra work that it can’t service, often queued.
- Errors
- The count of error events.
Cloud alert types
Metric alerts
- They are useful when you want to be alerted about data that requires little or no manipulation.
- Metric data is stored in the system already pre-computed, so metric alerts are less expensive than log alerts. Eg: database size alert.
Activity alerts
- Activity alerts provide auditing of all control plane actions that occurred on resources.
- Use activity alerts to be alerted when a specific event happens to a resource. Eg: Activity log alert on Azure. Eg: Create/Update/Delete Network Security Group in Azure.
Log alerts
- Log alerts allow you to perform advanced logic operations on your data.
- If the data you want to monitor is available in logs, or requires advanced logic, you can use the robust features of the querying language for data manipulation using log alerts.
Prioritisation
Prioritisation allows the right alerts to show up as notifications and reduce the noise. One way of specifying the priority is by using a severity level that indicates how critical a situation is.
| Severity | Description |
|---|---|
| Critical | Loss of service or application availability or severe degradation of performance. Requires immediate attention. |
| Error | Degradation of performance or loss of availability of some aspect of an application or service. Requires attention but not immediate. |
| Warning | A problem that doesn’t include any current loss in availability or performance, although it has the potential to lead to more severe problems if unaddressed. |
| Informational | Doesn’t indicate a problem but provides interesting information to an operator, such as successful completion of a regular process. |
| Verbose | Detailed information that isn’t very useful. |
Channels
- Push to an app(Eg: Slack or PagerDuty).
- SMS messages.
- Voice messages.
- Email.
Recipients
- Many orgs out there have alerts going to a single cloud team. While this makes for an easy setup, it greatly increases the load as also the signal to noise ratio for the team.
- Discussing the different personas for the cloud is a topic better off as a seperate blog post. However let us talk about them from an alerts perspective. Some of the different personas possible within the Cloud Operations team:
- Cloud Admins
- Platform team
- Site Reliability Engineers
- FinOps team
- SecOps
- Cloud Security Leads
- Cloud Security Engineers
- Based on the real world teams which exist, the right “owners” can be set for the different alerts. Its the responsibility of the “owners” to follow through with the process and respond to the alerts. Eg: Budget alerts can go to the FinOps team.
Use case

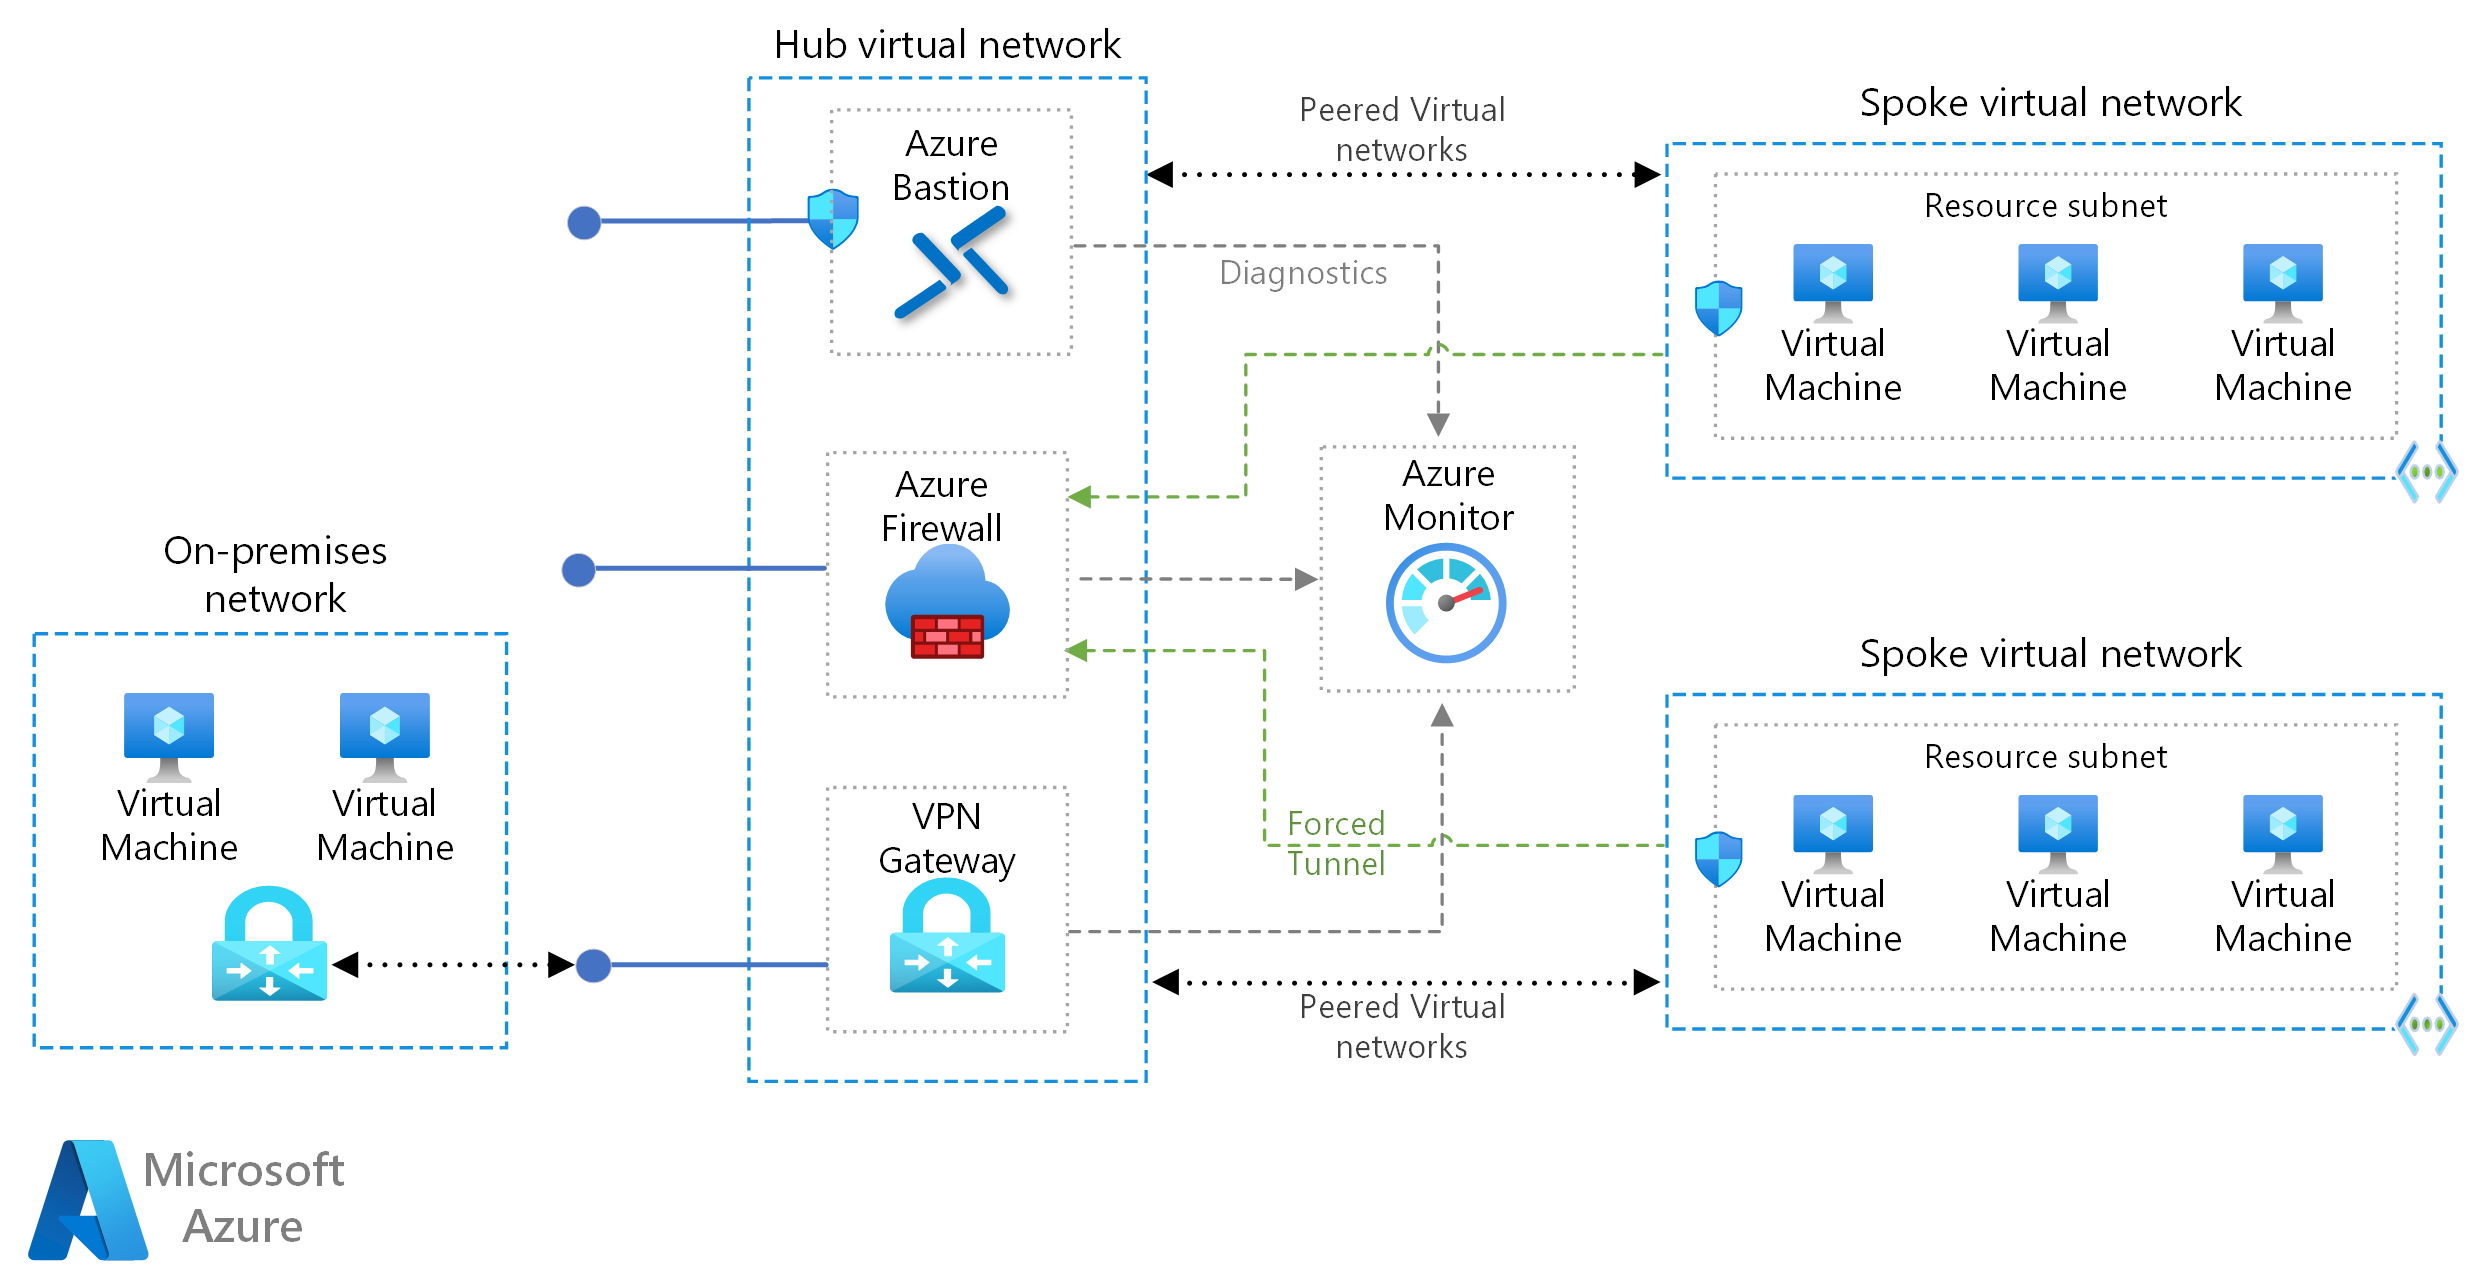
- An effective alerting strategy should be in line with the architecture of the cloud setup. If you take the below Hub spoke setup as an example, you can see which resources are critical for the uptime of the application.
- Examine each resource in this flow and apply the dimensions we discussed above. So examine each resource from left to the right - ie from the Firewall and VPN to the network peering to eventually the Virtual machine and database. Thus for each resource, you can:
- Identity alerts for each resource. Plenty of docs available for this.
- Prioritise the alerts. SLA can be used to determine this.
- Assign the right channel based on priority. Eg: Assign the critical ones to something like PagerDuty or Slack or Teams to ensure timely response.
- Ensure the right people are assigned ownership of the alerts. SLA can be used to determine response process and urgency.
- Here is an example of alerts for a virtual machine with suitable priority:
- VM availability metric falls below 1 (Machine unavailable) - CRITICAL.
- Percentage CPU is greater than 80% - WARNING.
- Available Memory Bytes is less than 1 GB - WARNING.
- Data Disk IOPS Consumed Percentage is greater than 80% - WARNING.
- OS Disk IOPS Consumed Percentage is greater than 80% - WARNING.
Best practices
The following points should be considered when configuring alerts:
- Having well-defined owners is vital to optimizing operational effectiveness. Alerts can be set for non-technical notifications too.
E.g. A budget owner should be made aware of capacity issues so that budgets can be adjusted and discussed. - Instead of having teams actively monitor the systems and dashboard, send reliable alert notifications to the owners.
- Alerts should be configured for specific resource types adjusted to maximize signal to noise ratios.
E.g. Only send a notification when a resource becomes unhealthy as per the defined requirements of the application health model or due to a cloud platform-initiated event. - Consider transient issues when setting an appropriate threshold for resource unavailability.
E.g. Configuring an alert for a virtual machine with a threshold of 1 minute for unavailability before an alert is triggered. - Use an automated alerting solution instead of having people actively look for issues.
- Add a group email address rather than specific persons so as to reduce the need to update the notification settings with every team member’s changes.
Takeaway - Use the steps given above to formulate a solid alerting strategy for your cloud setup. A “horses for courses” approach works really well to ensure a steady flow of alerts which isnt noisy.

